 |
Necessary tools:
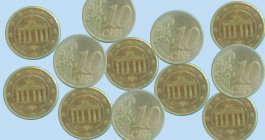
- 30 similar coins, these are modeling the radioactive nuclei
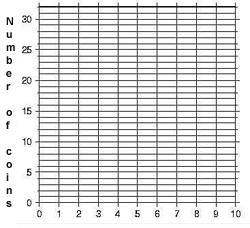
- Squared paper for graphical representation of the results
|
|
Realisation:
- Step 1: Toss the coins
- Step 2: Select the coins with heads and put them away. These are modeling the decayed nuclei
- Step 3: Count the coins remaining on the table, and note the result in a table like this.
- The previous 3 steps should be repeated until no more coins remain.
- Plot the number of the coins in function of the steps. (x –axis: number of steps, y-axis: number of coins)
|
|
If the result is plotted well, you get a curve similar to the first interactive exercise - F1. Questions (feedback) 1. How is the half-life of the nuclei modeled?
2. After one toss do we get always the half of the coins?
3. Why we get only similar graphs to the simulation and not exactly the same?
|
|


